
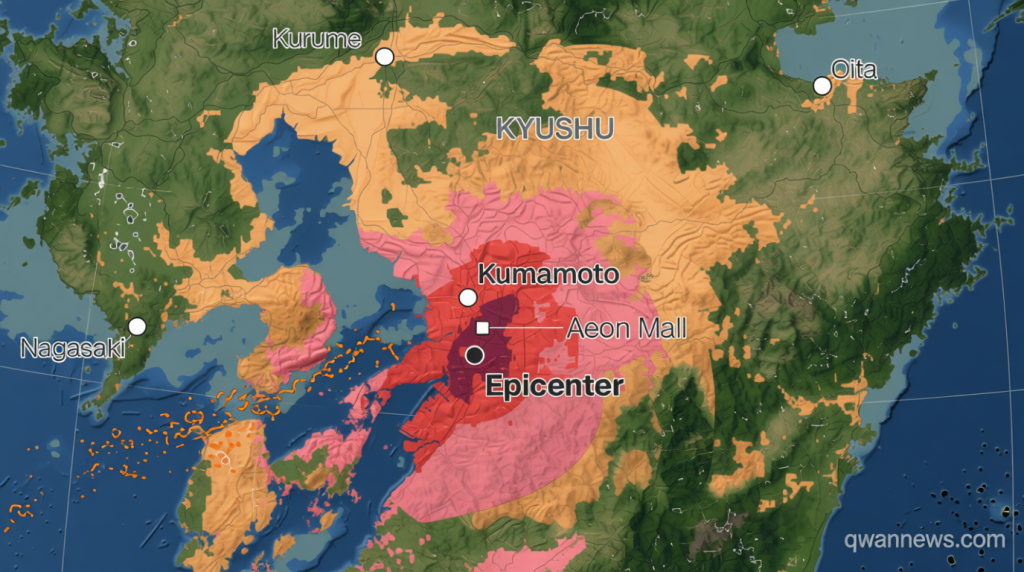
Tracking the impact of the Japan earthquake through visual data
Qwenews.com – Tracking the impact of the Japan earthquake has become a priority for news organizations and emergency response teams alike. A powerful 6.8 magnitude earthquake struck Japan’s southern Kumamoto prefecture on Tuesday, causing significant damage to buildings, killing several people, and injuring dozens more. This seismic event occurred in one of the most earthquake-prone countries in the world, where residents are accustomed to living with the constant threat of tremors and quakes. The earthquake was recorded on Kyushu, the southwesternmost of Japan’s four main islands, approximately 550 miles from Tokyo, the capital city. This distance from the nation’s largest urban center helped limit some of the potential casualties, though the local impact was substantial.
Historical context and regional vulnerability
The Kumamoto region is still reeling from a disastrous set of quakes in 2016 that killed hundreds, injured thousands, and caused widespread devastation to the economy and infrastructure. That earlier disaster included the famous Kumamoto Castle landmark, which suffered extensive damage during the tremors. The recurrence of significant seismic activity in the same area has raised concerns among geologists and local authorities about the cumulative stress on the region’s infrastructure. Buildings that survived the 2016 earthquakes are now being assessed for additional structural integrity following this latest event.
CNN is tracking the impact of the Japan earthquake through comprehensive maps and charts that provide visual representation of the affected areas. The incident is among more than 200 “significant” quakes in Japan since 2000, and its estimated magnitude would place it on the higher end of that scale, according to the US Geological Survey. Quakes such as Tuesday’s in Japan are measured on a magnitude scale that ranges from minor tremors to catastrophic events capable of reshaping entire landscapes.
The 6.8 magnitude reading indicates substantial energy release, comparable to events that have historically caused significant structural damage in populated areas.
This one, with its 6.8 magnitude, would be considered “strong” and carry the potential for damage to both residential and commercial properties. At least six additional quakes have been recorded in the region since the larger incident, with magnitudes ranging from 4.4 to 5.6, according to USGS. These aftershocks are typical following major seismic events and can continue for days or even weeks after the initial earthquake. Emergency services remain on high alert as they monitor the situation and prepare for potential additional tremors.
The visual tracking tools being employed include real-time maps showing the epicenter location, depth of the earthquake, and areas experiencing the strongest shaking. Charts displaying the magnitude progression help scientists understand the pattern of seismic activity in the region. These resources are invaluable for both the public and emergency responders who need to make quick decisions about evacuation routes and resource allocation.
Tracking the impact of the Japan earthquake continues as more information becomes available about casualties, damage assessments, and the effectiveness of emergency response efforts. The region’s history of seismic activity provides valuable context for understanding the current situation and preparing for future events. — CNN’s Hanako Montgomery contributed to this report.